After living with Zabbix for a while (Monitoring your electronic estate) I’ve come to the conclusion that the opinion I formed back in ~ 2015 still stands, I just don’t like it.
Looking for a better alternative (still not seeing one) I did come across something else that, while it doesn’t fill quite the same shoes, is also interesting from a monitoring perspective.
Now I looked at this previously, came to the conclusion it wasn’t free and moved on. On looking more closely, parts of it are free (!) and if you’re prepared to do a little leg-work, then you can get the meat of it for free … so I gave it a try. Here’s the dashboard I managed to get working …
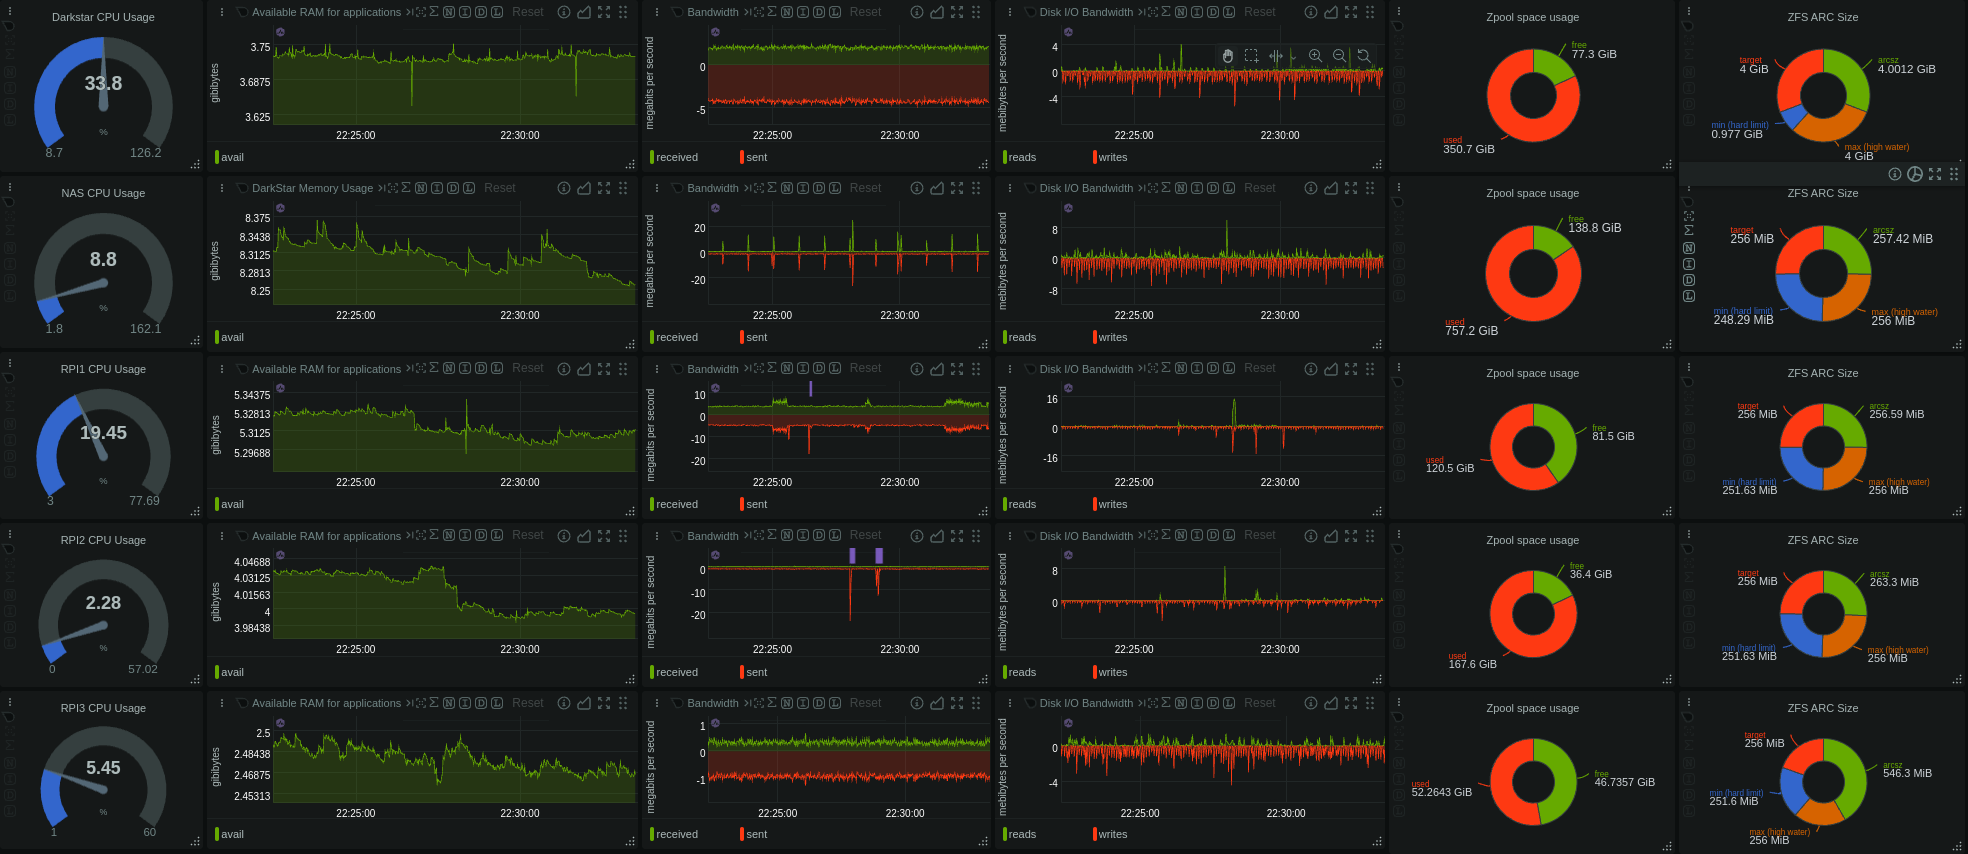
This is a custom dashboard showing five “managed” nodes (a PC and four Raspberry Pi’s), all running ZFS for data storage and INCUS for containers. This is a live display that updates in real time giving current CPU, memory, network IO, disk IO and ZFS stats. The “collector” that provides the aggregated dashboard is just “another” netdata instance running inside an INCUS container.
Now this just what I’m looking for, there are literally many hundreds of metrics you can chart in real-time with a bunch of different chart types. (show here are “gauge”, “filled” and “pie”)
Still experimenting to see what I can make it do, but from a server perspective it’s remarkably “lightweight”, probably a good bit less than running “top”. It is designed with one eye on trying to make you upgrade to the paid version, but you can get an awful lot out of the Open Source.
Note that if you use the “cloud” version, you’re effectively opting for a very limited version OR a paid for version. If you follow the docs and download an open source version, there are no limits etc in terms of numbers of nodes, you just don’t get some of the cloud frills they make available with the paid online service.